Wednesday, February 27, 2013

Get this right and you'll make a few bucks

Italian Election.
Unexpected outcome.
What happened then?


Basically 10y BTPs +40bp for the day, closing at the highs (yield-wise).
And 2y BTPs +45bp for the day. Same story.
Bear-flattening in italian bonds.
SX7E Eurostoxx Banks fell 5.23% for the day.
Banks crashed.
Intesa San Paolo was halted, limit down. Consob, italian regulators, banned short-selling.

German bonds skyrocketed.
French yields x German yields, on the 2y tenor (here, I mentioned I thought a good trade) +3bp for the day @ 12bp premium France x Schatz.

Spanish SPGBs +20bp on both 2y and 10y ends of curve.

Basically political problems caused this. Lack of consensus. Lack of support from population to "do things right". Italians basically supported Berlusconi's party more than people expected and the political parties involved in power are too different from each other to sit around a table to reach agreement to rule the country. And Berlusconi doesn't get along with Merkel much. And German elections are in September, I guess.

So basically... if you get this right: will the clown, the party monster and the dull agree on something and get Italy going or not?
You have the direction of the overall markets for the next few weeks.
Why is that?

Because of the transmission mechanisn the shape and level of the yield curve has on banks and therefore credit.

Not a single italian bank repaid LTRO money. That's what I read today.

So when there's a bear flattening (bond prices going down, but the short-end yields rising more than the long-end's) means:
a/ More expensinve short-term funding for banks
b/ While it reduces its net-interest-margin (banks lend longer term) reducing outlook for profits...
c/ And get their bond books crushed due to the rising yields on the long-end of the curve, marking their loans to market negatively = hurt current profits.

So that means less profits for banks.
So less appetite to lend.
And with less credit around the economy.... less aggregate demand, investments, etc.
That means less confidence, and go back to "rising yields further" due to global fears towards the country.
Wash-rinse-repeat.

So if you know a lot about politics and have a strong view on this... it's a good time to act. It's all close to highs while economic activity isn't quite there yet.

The funny thing is, contrary to August last year (http://thetailchaser.blogspot.com.br/2012/08/risk-on.html) , when I mentioned the left-tail of the market was gone because of Draghi's bumble-bee speech, OMT... now italians don't even have leadership to, if needed, reach an agreement to request aid to OMT.

Funny.


*Disclaimer: charts and data are presented as I receive/see them. Sources are usually not checked for validation and my own calculations are of 'back of the envelope'-type. I am aware that some math that I do myself might be wrong and/or misleading to some extent. In financial markets the rate of change of economic data is often more important than the actual level and the perception of 'what is priced in' is more important than 'what is actually going to happen'. This is actually the way people pick entry and exit points. So... yes, sometimes you might say 'This guy is an idiot, this is way wrong!' with a high conviction, being right. Not to worry. Markets are made of expectations and the clash of conviction between its participants. Portfolio managers know that being an idiot is sometimes profitable and being smart is often a bad choice. It is all reality, sometimes good, sometimes bad. By the way: corrections to my analysis and intelligent debate is welcome. theintriguedtrader AT gmail do com

Tuesday, February 26, 2013

Another few more charts on Brazil [Credit]

These charts go to illustrate the gigantic mess that the brazilian government has put the country in.

They're basically outstanding loans, deflated by the IPCA (consumer price inflation).

They show that a/ credit has been slowing, and slowing, and slowing, despite 500bp in rate cuts since the end of October 2011.
And to show how bad the local government has handled the situation, by making quasi-public banks (Banco do Brasil, BBAS on Bovespa) and public (Caixa Econômica Federal, CEF, not listed) flood the market with cheaper credit, despite, perhaps, lower credit quality of borrowers, squeeze private banks out of the market, in order to decrease credit spreads, then banks' profitability, but at a cost of risking a surge in bad loans, which has already showed up... and kept up despite the 500bp in cuts.

Here are the charts, self-explanatory.

 As expected by the horrible CAGED #s (Formal Job Creation) from last week...


And now the credit charts....


 And the private banks in lending...


 And the Personal Default rate that doesn't give in much despite so much time passed since it peaked and the 500bp in rate cuts...


*Disclaimer: charts and data are presented as I receive/see them. Sources are usually not checked for validation and my own calculations are of 'back of the envelope'-type. I am aware that some math that I do myself might be wrong and/or misleading to some extent. In financial markets the rate of change of economic data is often more important than the actual level and the perception of 'what is priced in' is more important than 'what is actually going to happen'. This is actually the way people pick entry and exit points. So... yes, sometimes you might say 'This guy is an idiot, this is way wrong!' with a high conviction, being right. Not to worry. Markets are made of expectations and the clash of conviction between its participants. Portfolio managers know that being an idiot is sometimes profitable and being smart is often a bad choice. It is all reality, sometimes good, sometimes bad. By the way: corrections to my analysis and intelligent debate is welcome. theintriguedtrader AT gmail do com

Friday, February 22, 2013

Brazil is doing great. Huh?

My case for being bearish EM is based on data points I am seeing for a variety of EM/growth-linked economic performances contrasted with their respective asset prices, especially Sovereign bonds yields, not spreads.

I’ll leave you with charts for Brazilian Formal Employment Creation, Foreign Investment Flows, Current Account (Exports have declined some 15-20bln, with stable Imports SO FAR). These were released today.

Brazilian inflation is running high even after the Government changed some tax rules to hammer the headline down a bit through the past couple of years. It’s not Argentine INDEC yet. Not close. But it’s tricky. 
The BACEN cut 500bp in rates and the economy is still sliding sideways, not bringing in any kind of fantastic numbers. No job growth. Much worse than the US.

So… check Mexican data out. Check Canadian data out. It is very tough to believe China is going to recover under this environment and tough to believe the US is any good after these fiscal budget cuts.
Or that South Korea will get back on their feet with this weak JPY.

So…

A few funny charts.
Have a fantastic weekend.

PS: On the Foreign Investment front, if you exclude capital that went into Petrobras (PBR Equity) in late 2010... the chart would look uglier than it is right now. The company is spending a lot of cash, but crude production growth keeps disappointing. They can't raise gasoline/diesel prices because the government wants to keep inflation down, subsidizing consumers, screwing PBR's shareholders.


*Disclaimer: charts and data are presented as I receive/see them. Sources are usually not checked for validation and my own calculations are of 'back of the envelope'-type. I am aware that some math that I do myself might be wrong and/or misleading to some extent. In financial markets the rate of change of economic data is often more important than the actual level and the perception of 'what is priced in' is more important than 'what is actually going to happen'. This is actually the way people pick entry and exit points. So... yes, sometimes you might say 'This guy is an idiot, this is way wrong!' with a high conviction, being right. Not to worry. Markets are made of expectations and the clash of conviction between its participants. Portfolio managers know that being an idiot is sometimes profitable and being smart is often a bad choice. It is all reality, sometimes good, sometimes bad. By the way: corrections to my analysis and intelligent debate is welcome. theintriguedtrader AT gmail do com

Wednesday, February 20, 2013

What wil 2013 bring us? I'm not happy.


Quick note. Wrote this last night. Updated today after mkt closed.


Right now, I think this year's main drivers are:

- Chinese policy makers using stimulus to 'buy dips' in economic activity: they won't do anything to speed up growth, but enough to keep wage growth going/unemployment from rising, in order to keep social stability, rebalance economy and reduce share of (unproductive) investments in the economy, therefore reducing the demand for credit growth. There's simply TOO MUCH credit growth for too little nominal and real growth. They're scared. They still can’t cope with 1/ inflation and 2/ real estate prices too high. Commodities will suffer. Read: Australia, Canada, Brazil, some others. 

- The impact of a much weaker JPY on East Asian (regional trade is more intense than long-range trade) and countries with high export similarity index with Japan [Germany (machinery, auto industry), South Korea (tech, autos) and perhaps Mexico (US-linked, but auto is just getting new investments, etc)]. Read: South Korea, Germany, other East Asian

- I've written about this already: the US fiscal drag hurting the economy much more than expected due to the ongoing balance sheet recession/deleveraging (Koo’s theory, exemples of Japan 1997, UK now, EZ to some extent). 

- EM underperformance: I just believe the world has relied too much on Chinese/EM/Commodities-based growth, expectations are too high both for growth and returns. Assets are being priced against ‘averages’ from periods of booming growth (read productivity and macro stabilization, flood of capital), secular drop in inflation and interest rates, and, after a round of monetary easing since 2011, and too much of macro-prudential measures, these economies are saturated by external capital flows away from USD, EUR, GBP, JPY and others. They’re not the saviors. They don't have enough cheap labor anymore. (Good piece by CLSA's Russell Napier on this, another good piece by Michael Gomez from PIMCO).


And the positives would be: Policy Makers maintaining their feet on the monetary and fiscal pedals until one of the two happens first.
1/ Growth really picks up
2/ Markets give up on monetary policy... and suffer.

I don't believe in (1) if the Fed, or the BoE, or the ECB, or the BOJ, or the SNB, or the PBoC etc, etc, etc, start talking about retracting from monetary expansion. There's too much addiction to low nominal and/or negative real rates. Dangerous. 


Seth Klarman isn't a Macro investor. He runs a very bottom-up, value, margin-of-safety shop, but he has been on the street for a long time and I think talks to many people in order to formulate his ideas of where we are in the world. He can't find cheap securities. Why will I? I'll end up saying that the marginal utility of global debt has reached its limits in my humble opinion. (chart from Hayman's letter).


Seth Klarman, the hedge-fund manager who runs Boston-based Baupost Group LLC, said risks to financial markets today are in some ways greater than they were before the 2008 crisis once governments around the world halt their aggressive stimulus. 
“The real downside scenario -- which concerns us greatly - - involves the end of the ‘free lunch’ of large deficits, zero interest rates, and relentless quantitative easing,” Klarman wrote in a 19-page year-end letter to Baupost investors obtained by Bloomberg News. “This story line would take the form of a currency, sovereign, or economic crisis inciting panic throughout the financial markets.”

I'd like to also leave a link to Jeremy Stein's speech from Feb 7th. And perhaps everyone should read the latest Howard Marks' piece when he mentions that credit is already expensive too in the US.


.

Chart from excellent piece by Niels Jensen from Absolute Return Partners Dec12 - "In Search for the Holy Grail".


*Disclaimer: charts and data are presented as I receive/see them. Sources are usually not checked for validation and my own calculations are of 'back of the envelope'-type. I am aware that some math that I do myself might be wrong and/or misleading to some extent. In financial markets the rate of change of economic data is often more important than the actual level and the perception of 'what is priced in' is more important than 'what is actually going to happen'. This is actually the way people pick entry and exit points. So... yes, sometimes you might say 'This guy is an idiot, this is way wrong!' with a high conviction, being right. Not to worry. Markets are made of expectations and the clash of conviction between its participants. Portfolio managers know that being an idiot is sometimes profitable and being smart is often a bad choice. It is all reality, sometimes good, sometimes bad. By the way: corrections to my analysis and intelligent debate is welcome. theintriguedtrader AT gmail do com

Friday, February 15, 2013

South Korea: Exports similarities + Monetary + Credit Growth

Just a few more charts on South Korea.
The most important one speaks about the impact of the weak JPY on the Korean exports.
That's a ranking on "Export Similarity Index" by the IMF, from 2008 study.
Germany is first, in a much weaker regional economy, but the regional economy is also in EUR.
And second.. SK.
And with Annual Exports accounting for 50% of GDP, I sense SK as fragile.


*Disclaimer: charts and data are presented as I receive/see them. Sources are usually not checked for validation and my own calculations are of 'back of the envelope'-type. I am aware that some math that I do myself might be wrong and/or misleading to some extent. In financial markets the rate of change of economic data is often more important than the actual level and the perception of 'what is priced in' is more important than 'what is actually going to happen'. This is actually the way people pick entry and exit points. So... yes, sometimes you might say 'This guy is an idiot, this is way wrong!' with a high conviction, being right. Not to worry. Markets are made of expectations and the clash of conviction between its participants. Portfolio managers know that being an idiot is sometimes profitable and being smart is often a bad choice. It is all reality, sometimes good, sometimes bad. By the way: corrections to my analysis and intelligent debate is welcome. theintriguedtrader AT gmail do com

Wednesday, February 13, 2013

Will US growth really pick-up? [EZ+UK 2010-2012 analogs]

It's been tough to swap my free time to actually write here, but I feel the need to organize my thoughts into 2013. Ray Dalio is thinking differently than me and him and his team are smart people, who do a lot of research, etc. It's late, around 11pm.

So...

Maybe I have read too much of Richard Koo.

What does he repeat on a regular basis in his pieces?
- Most of the developed world is in a balance-sheet recession.

What does that mean?
// Households and Corporates are saving in order to reduce their overall debt levels, even though interest rates are so low. The DEMAND for credit is low/negative, therefore monetary policy loses traction.
// Therefore Governments must fill the gap through public spending to keep aggregate demand supported.

Something along those lines. I'm not an academic.


Or maybe the IMF paper about "fiscal multipliers in downturns and upturns" that was so publicized recently fits the theory in my mind...
The summary says:
Summary: Only a few empirical studies have analyzed the relationship between fiscal multipliers and the underlying state of the economy. This paper investigates this link on a country-by-country basis for the G7 economies (excluding Italy). Our results show that fiscal multipliers differ across countries, calling for a tailored use of fiscal policy. Moreover, the position in the business cycle affects the impact of fiscal policy on output: on average, government spending, and revenue multipliers tend to be larger in downturns than in expansions. This asymmetry has implications for the choice between an upfront fiscal adjustment versus a more gradual approach.


I read some people disregarded some of the conclusions on this paper on the basis that the current, ongoing, economic issues have a few peculiarities, etc. But I am not an academic. In my head it makes sense, just as I believe the Ibovespa has a higher Beta to the SPX on market routs than it has Beta to the SPX on market rallies. I can come up with untested reasons for that, such as lower liquidity and currency risk.
Or the psychological drag human minds have when they're depressed and take another hit. Our beloved race can't stand pain. A 'unit of happiness' has an utility value smaller than one 'unit of sadness'. Something along those lines.


So where does the EZ/UK analog from the title of this post?


The UK:
- Free-floating currency.
- BOE had massive QE program.
- The Olympic Games that happened recenly
- And the Government did some amount of marginal fiscal drag.


Eurozone:
- Pseudo-Gold standard as currency.
- ECB started out with hawkish Trichet which pulled liquidity squeezing banks/collateral values, etc...  with SMP, Draghi-the-Dragon, then rate cuts, LTROs and then powerful "believe me, it will be enough" vocal chords which culminated with OMT.
- And... Fiscal Drags.


And the US:
- Free-floating currency
- Grand QE scheme
- And just NOW, a pop in fiscal drag!


So far we have the US growing more than the UK which has grown more than the Eurozone.
As I usually say: perhaps I am using statistics that please my idea/framework, but here are two charts.

The first one is of the Budget Deficits of all three mentioned, but subtracting their starting fiscal balances (end-2007), in order to normalize: "Who Boosted Spending the Most When Crisis Hit?".


And the chart already says it, the US was also the one who still runs the larger deficit of all three.


So to keep things objective: I fear for US economic activity more than the consensus. They have JUST STARTED a larger fiscal drag, from a higher fiscal deficit level. The consensus has gotten things wrongs so many times, with their dozens of econometric models, data-mining, even decades of experience, so... I read the consensus, and try to come up with reasons to agree or disagree with it. Right now I disagree. But market prices disagree with me. Or I am missing other pieces of the puzzle. Is Hussman correct? Is the ECRI correct?

A few interesting data-points:


// 4Q12 US Personal Income had a boost due to antecipated dividends which were paid to avoid higher taxation from the so-called Fiscal Cliff. If it wasn't for above-normal dividends the number, instead of +2.6%, would come in as 0.6%, in line with expectations of 0.8%.


// So now we look at US Retail Sales. Sharply revised Nov12 and Dec12 #s, very strong, just to slowdown to almost a stand-still in Jan13. Were the Nov-Dec12 #s strong due to Sandy giveback and/or this excessive antecipated jump in Personal Income due to extraordinary dividends? I don't know.


// A sequential slowdown in NFP growth. I've read somewhere that Small Business are the engine of job growth. 


// Here's the NFIB Small Business Conditions. It's barely at the 2011-low level, dragged by "Outlook for the Economy" which made new all-time-lows and recovered a bit in the past 2 months. Hiring plans remain depressed.


// And Core Capital Goods ORDERS, coming in negative for December after 2 strong months.


So here we have, so far, a slow down in Income (possibly, check out the Taxes Withheld at the US Treasury change in trend, despite still very high levels historically), likely slower due to a) less dividends and b) the payroll tax hikes, consequently a slow down in Retail Sales and also a slow down in Employment growth, Investments?

Interesting, because if balance sheet recessions really exist and the examples of the Eurozone, or more appropriately, the UK, count... perhaps the US is just about to underperform. And we know what happens when the US underperforms. The world gets sick.

Oh, and by the way, suggestions/criticism is VERY welcome.


*Disclaimer: charts and data are presented as I receive/see them. Sources are usually not checked for validation and my own calculations are of 'back of the envelope'-type. I am aware that some math that I do myself might be wrong and/or misleading to some extent. In financial markets the rate of change of economic data is often more important than the actual level and the perception of 'what is priced in' is more important than 'what is actually going to happen'. This is actually the way people pick entry and exit points. So... yes, sometimes you might say 'This guy is an idiot, this is way wrong!' with a high conviction, being right. Not to worry. Markets are made of expectations and the clash of conviction between its participants. Portfolio managers know that being an idiot is sometimes profitable and being smart is often a bad choice. It is all reality, sometimes good, sometimes bad. By the way: corrections to my analysis and intelligent debate is welcome. theintriguedtrader AT gmail do com

US Jobs Openings, Labor Turnover...

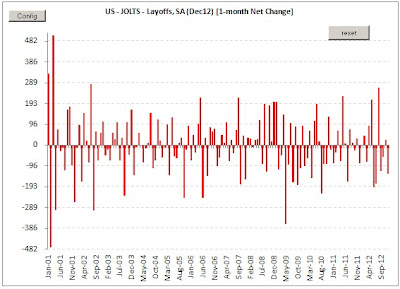
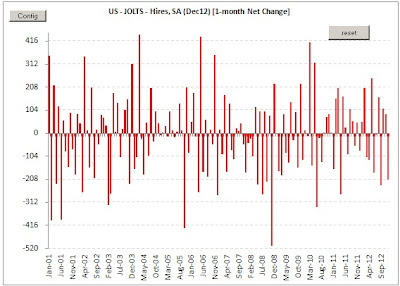
Just the December (lag...) JOLTS report.
Like the JANUARY 2013 report, shows a slowing trend in [Hires - Separations], where Separations = Quits + Layoffs + People leaving workforce such as retired, invalid, etc.

The components, besides the reduction in Layoffs, don't look fantastic, with Openings, Hires and Quits (people less optimistic to leave their jobs and looking for a new one...) dropping in Dec12.


*Disclaimer: charts and data are presented as I receive/see them. Sources are usually not checked for validation and my own calculations are of 'back of the envelope'-type. I am aware that some math that I do myself might be wrong and/or misleading to some extent. In financial markets the rate of change of economic data is often more important than the actual level and the perception of 'what is priced in' is more important than 'what is actually going to happen'. This is actually the way people pick entry and exit points. So... yes, sometimes you might say 'This guy is an idiot, this is way wrong!' with a high conviction, being right. Not to worry. Markets are made of expectations and the clash of conviction between its participants. Portfolio managers know that being an idiot is sometimes profitable and being smart is often a bad choice. It is all reality, sometimes good, sometimes bad. By the way: corrections to my analysis and intelligent debate is welcome. theintriguedtrader AT gmail do com