A few weeks ago I talked about the KRW short here.
Back then I had to add a few charts about the country's External Accounts, etc.
So today I'll add them here for illustrative purposes. I don't take these as hard-science since I consider a lot of this subject as self-reinforcing trends x policy maneuvers, etc.
Competitiviness (starting point), macro stability (so external capital can sleep at night) and high returns on capital attract portfolio or direct investments, which propels growth, domestic income increases, internal consumption, etc, etc and then the herd effect takes care of keeping the currency going even if it is now expensive, players leveraged and returns too low (or bets crowded), etc.
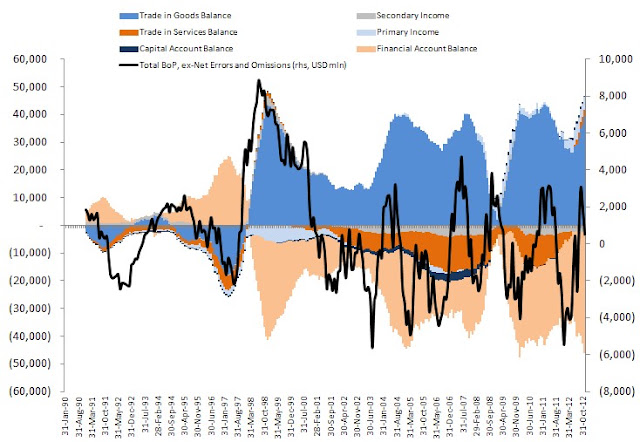
All charts are 12-month rolling sums, not stock of capital for each account.
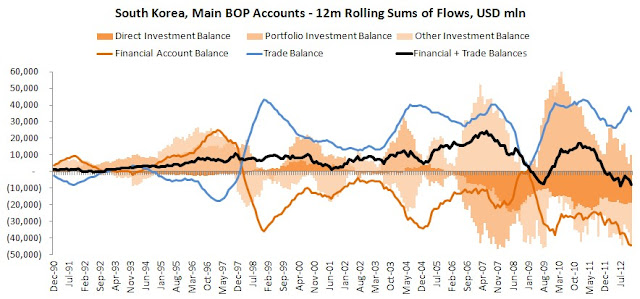
From the 1993-1995 period we had basically increasing sums of money pouring into South Korea through:
1) Increasing Portfolio Investment inflows
2) As the KRW becomes more expensive the Net-Exports position deteriorates and becomes negative YoY...
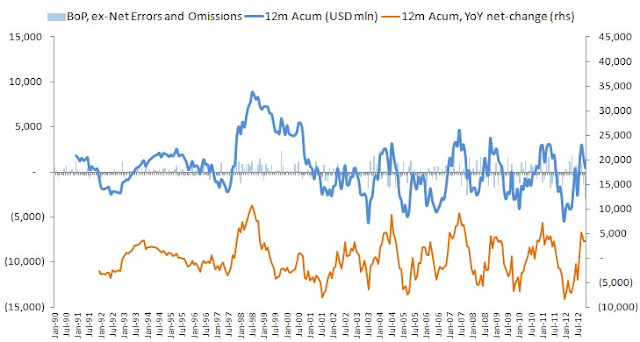
By end of 1995 the 12m rolling sum of these accounts becomes negative and the KRW stabilizes/tops with a deteriorating trend in Net-Exports being offset by herd behavior into Portfolio and Direct Invesments (that lasted a while longer).
Then we have the halt in Exports growth (which were strong in 1992-1994).. an acceleration in Net-Exports and when the crisis erupted in other East Asian nations... we know the story. The key-hole was too small for the elephant to squeeze himself out of the room and currency crisis set in, taking with it asset prices that needed to be converted into foreign currency to leave the country.
So here are the charts.
As the disclaimer mentions: This is just the framework I use to try to put pieces of the puzzle together. These are not necessarily causal relationships discovered through robust econometric models or anything of the likes. This is a simple way to look at flows in capital, leverage and liquidity and where policy is aimed at for the time being.
Right now I beliece policy makers are getting worried about the strength of the country's currency.
Exports are a much bigger chunk of the GDP, net-exports are the drivers of the positive current account while global growth is still lower than what it was during the last decade and alternatives for yields aren't so easily found.
They'll fight for a weaker currency too.
Back then I had to add a few charts about the country's External Accounts, etc.
So today I'll add them here for illustrative purposes. I don't take these as hard-science since I consider a lot of this subject as self-reinforcing trends x policy maneuvers, etc.
Competitiviness (starting point), macro stability (so external capital can sleep at night) and high returns on capital attract portfolio or direct investments, which propels growth, domestic income increases, internal consumption, etc, etc and then the herd effect takes care of keeping the currency going even if it is now expensive, players leveraged and returns too low (or bets crowded), etc.
All charts are 12-month rolling sums, not stock of capital for each account.
From the 1993-1995 period we had basically increasing sums of money pouring into South Korea through:
1) Increasing Portfolio Investment inflows
2) As the KRW becomes more expensive the Net-Exports position deteriorates and becomes negative YoY...
By end of 1995 the 12m rolling sum of these accounts becomes negative and the KRW stabilizes/tops with a deteriorating trend in Net-Exports being offset by herd behavior into Portfolio and Direct Invesments (that lasted a while longer).
Then we have the halt in Exports growth (which were strong in 1992-1994).. an acceleration in Net-Exports and when the crisis erupted in other East Asian nations... we know the story. The key-hole was too small for the elephant to squeeze himself out of the room and currency crisis set in, taking with it asset prices that needed to be converted into foreign currency to leave the country.
So here are the charts.


As the disclaimer mentions: This is just the framework I use to try to put pieces of the puzzle together. These are not necessarily causal relationships discovered through robust econometric models or anything of the likes. This is a simple way to look at flows in capital, leverage and liquidity and where policy is aimed at for the time being.
Right now I beliece policy makers are getting worried about the strength of the country's currency.
Exports are a much bigger chunk of the GDP, net-exports are the drivers of the positive current account while global growth is still lower than what it was during the last decade and alternatives for yields aren't so easily found.
They'll fight for a weaker currency too.
*Disclaimer: charts and data are presented as I receive/see them. Sources are usually not checked for validation and my own calculations are of 'back of the envelope'-type. I am aware that some math that I do myself might be wrong and/or misleading to some extent. In financial markets the rate of change of economic data is often more important than the actual level and the perception of 'what is priced in' is more important than 'what is actually going to happen'. This is actually the way people pick entry and exit points. So... yes, sometimes you might say 'This guy is an idiot, this is way wrong!' with a high conviction, being right. Not to worry. Markets are made of expectations and the clash of conviction between its participants. Portfolio managers know that being an idiot is sometimes profitable and being smart is often a bad choice. It is all reality, sometimes good, sometimes bad. By the way: corrections to my analysis and intelligent debate is welcome. theintriguedtrader AT gmail do com
No comments:
Post a Comment