Tuesday, May 31, 2011

New Trade: USDCNY 3y Calls

So I have posted about this one trade in currencies:

LONG combination of these:commodities + strong domestic demand + good demographics and room for productivity gains + balance sheets + high yields > BRL, CLP, CAD, NOK, CHF (30% / 15% / 20% / 20% / 15%)

versus

SHORT Printing Presses: USD, EUR, GBP (33% each), perhaps short 3-5% AUD.


The drivers are pretty straight-forward: I do not believe these countries will be able to get out of their current economic situation without printing their way out.
The Americans have a huge pile of sovereign and private debt. Policy makers won't be able to either raise interest rates or cut fiscal stimulus. Stimulus means printing. Raising rates means risky-markets should collapse bring economic activity with it. That means more all-kinds-of stimulus.
Repeat for the EUR block.
Repeat for the UK.

These 3 guys are now into the deleveraging process, coupled high unemployment, high fiscal deficits and retiree-wannabe-but-can't-cuz-I-got-no-savings baby boomers. Not to mention they have spent their small savings on an iPad 2 and a bunch of apps.

On the long side of the equation we have countries where demographics in most cases should remain reasonably good, where balance sheets are much, much better on aggregate, where real interest rates look better, where domestic demand is also reasonably robust and their exposure to commodities and global growth is alright.

What do they lack? They sort-of-lack capital. And that's the main risk to the trade.

Stress in the global financial markets means invested capital (hot money flows and FDI) fleeing these countries would happen, as history has taught us.

In this case we have added the CHF as the safe-heaven currency. And also we could get some JPY there even though I am NOT a fan of Japan. But these guys have massive savings in external assets and a (currently) positive current account. Capital flies to japanese-quality heaven when things go sour. This means in stress, as history has also shown us too, the JPY could also reduce the volatility of this trade, improving its risk-reward profile.

NOW.... I am siding with Mark Hart (Corriente Advisors) and Jim Chanos (Kynikos) on a bet against China.

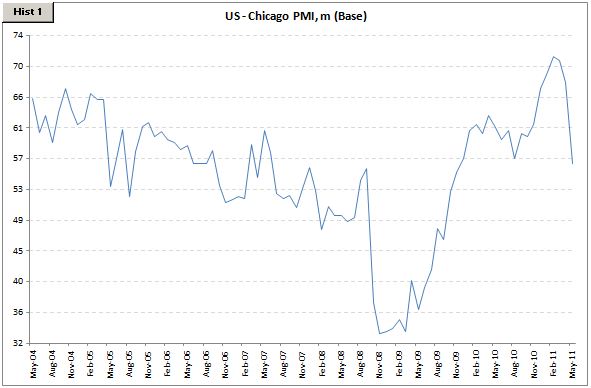
First: because in case China goes bust or slows downs considerably these commodity-linked Currencies will take a beating. A hard one. Like they did in 2008. The Commodities market went bust before the Armageddon hit global equities. So currencies took a beating then too. That was China and its Housing Starts numbers going south in late 2007-early 2008.

Second: fundamentals.
Credit expansion (what a boost they had in early 2009, throughout today!) has been huge.
This credit fueled an impressive streak of fixed asset investments, but with overcapacity now lingering in some sectors and the domestic demand unable to pick-up as fast consuming these investments (be it through usage of roads or the purchase of 1st homes, etc) it seems to me some of this returns are bad and the credit is heading towards default.
Inflation is picking up, with food inflation being the worst (some say 10%), ghost towns are being formed (lots of videos on this out on the web, Frontline, Bloomberg, etc).

Third: Asymmetry
The market is packed on the long-CNY trade. That means lots of people selling volatility, perhaps to fund the short USDCNY trade through NDFs. Even though nominal rates in China are higher than those in the US the NDF curve is inverted (contrary to the curves in Brazil, Chile, Australia, etc, etc, etc). Investors are piling onto this trade and the NDF curve 3 years out has an implied 5.2% appreciation (1.70% year) even though rates differentials point to an 8% depreciation. That is a 13.2% gap. OK, I won't argue that market prices are market prices. But I'd like to accept this distortion which I find favorable.

With the CNY spot being controlled by the Chinese the market has priced in very, very low implied volatility for options on it.
And that means opportunity. Skew.

So what is the call here?
Buy 3y USDCNY Calls with a Strike of 6.80 (put CNY / call USD)
OTM from Spot: -4.7%
OTM from 3y fwd: -9.4%

Volatility was offered at 7.2% and the premium at 1.63%.

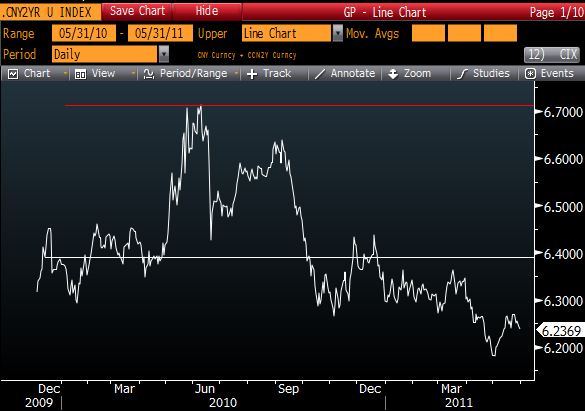
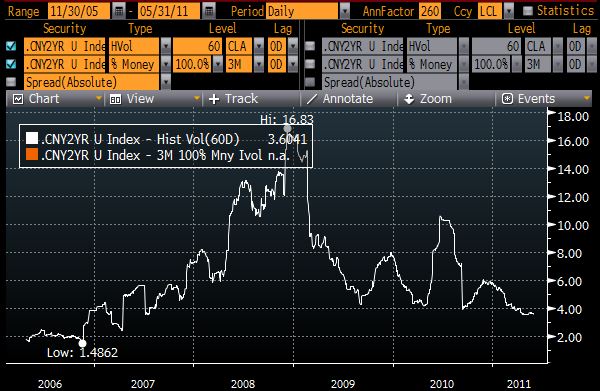
In 2010, when the European Debt Issues started roiling markets the 2y NDF (so consider this trade one year from now...) went from around 6.40 to 6.70, that is a 4.70% move. And historical volatility went from the bottom of 4.5% to around 10.60%. And implied volatility trades above historical volatility.
So with a decent stress I see this trade paying at least 3/5 to 1, so 5%-8% return. If the stress is actually bad enough (EUR taking a beating?) I see this multiplied by 2 or 3.

So...

The currency basket is a high yielding play with lower volatility due to its construction. It should perform well with low yields in the US/UK/Europe, with modest-to-low growth in these countries and the on-going growth in EM (read China). Basically status-quo.
And the HEDGE (CNY put / USD call), to me, is considered another new trade, but it actually adds to the portfolio nicely as I believe it serves a great hedge in case the world goes buh-bye again.

Opinions?
Questions?
"You are wrong!"?


*Disclaimer: charts and data are presented as I receive/see them. Sources are usually not checked for validation and my own calculations are of 'back of the envelope'-type. I am aware that some math that I do myself might be wrong and/or misleading to some extent. In financial markets the rate of change of economic data is often more important than the actual level and the perception of 'what is priced in' is more important than 'what is actually going to happen'. This is actually the way people pick entry and exit points. So... yes, sometimes you might say 'This guy is an idiot, this is way wrong!' with a high conviction, being right. Not to worry. Markets are made of expectations and the clash of conviction between its participants. Portfolio managers know that being an idiot is sometimes profitable and being smart is often a bad choice. It is all reality, sometimes good, sometimes bad. By the way: corrections to my analysis and intelligent debate is welcome. theintriguedtrader AT gmail do com

JP Morgan's Freoli: No QE3. Right...

Short-end rates in the US, Europe, Britan and Japan have collapsed.
The Citi Economic Surprise Index (below) went down.

And risky-assets have rebounded, hard-assets currencies have also performed really well with volatility dropping.

All that with economy numbers coming down and the european debt woes.
It sounds like QE3 (or something in that direction) to me... like the Japanese did (increased..) after the quake.


QE3?

 
Our answer is: no. We think it is very, very unlikely. In a nutshell, we don't think the inflation or inflation expectations data are near the point where the Fed would consider further large-scale asset purchases, and even if the inflation data were to start to move in that direction the potential political fall-out is so great that the Fed would be extremely reluctant to purchase more assets.
 
The recent economic activity data has been decidedly disappointing. By some broad measures such as GDP, it could well be the case that the first half of this year will look even worse than the second and third quarters of last year -- the quarters leading up to the FOMC's decision to purchases another $600 billion of assets. While the growth data may look similar, a crucial difference thus far has been inflation. Last year, core inflation was decelerating through the middle part of the year. So far this year, core inflation has run below the Fed's target but at least it has shown signs of possibly moving back up toward the target. Just as important, inflation expectations were moving down last year; this year they have held up fairly well. These expectations may have received a boost from QE2, a boost which is about to fade. Indeed, the Fed's own measure of 5yr-5yr forward TIPS breakeven inflation expectations is near the lower end of the range seen since the November QE2 decision. Nonetheless, if we are right that growth will improve in the second half this should give some support to pricing power and to inflation expectations.
 
Even if we are wrong on a second half rebound, we still believe the political hurdle for further asset purchases is tremendously high. The backlash from Capitol Hill after last Fall's decision probably took the Fed off-guard, and the political impact was not a prominent factor debated in the lead-up to the November decision. Our sense is that this time around it would have to be a major consideration, even if such a sentiment is not expressly conveyed in public communications from Fed officials.
 
In the absence of further asset purchases, what options are available to the Fed if the current soft patch does not prove to be transitory? In a February speech, Vice Chair Yellen discussed some policy options "if there were an unexpected faltering of the recovery." Two options were mentioned, both relating to communications. First, the Fed could adjust forward guidance to push back expectations of the timing of the first hike, and second, they could shift back expectations regarding the timing of when the Fed contracts its balance sheet. Given that it appears the market is currently pricing in very little Fed tightening, either traditionally or through balance sheet renormalization, the marginal impact of either of these steps for easing financial conditions is likely quite limited. As such, it appears that without taking significant political risks there is little the Fed is able to do to support the recovery if growth fails to rebound as anticipated next quarter.
 
[image]


(1-212) 834-5523
michael.e.feroli@jpmorga...
JPMorgan Chase Bank NA

*Disclaimer: charts and data are presented as I receive/see them. Sources are usually not checked for validation and my own calculations are of 'back of the envelope'-type. I am aware that some math that I do myself might be wrong and/or misleading to some extent. In financial markets the rate of change of economic data is often more important than the actual level and the perception of 'what is priced in' is more important than 'what is actually going to happen'. This is actually the way people pick entry and exit points. So... yes, sometimes you might say 'This guy is an idiot, this is way wrong!' with a high conviction, being right. Not to worry. Markets are made of expectations and the clash of conviction between its participants. Portfolio managers know that being an idiot is sometimes profitable and being smart is often a bad choice. It is all reality, sometimes good, sometimes bad. By the way: corrections to my analysis and intelligent debate is welcome. theintriguedtrader AT gmail do com

Richard Koo - Fiscal Consolidation Not the Answer

Richard Koo from Nomura talks about many topics.

Is the global monetary and fiscal tightening and FX-intervention impacting the global economy? Was it Japan that caused all this damage seeing in global industrial production? Or is it a combination of all factors?
Developed economies trying to blame others for austerity-induced economic weakness

It is extremely dangerous for the government to save more at a time when the private sector is also generating surplus savings in spite of zero interest rates. Yet that is just what the Obama administration and most of the other G8 members are doing, to a greater or lesser extent.

Moreover, domestic political considerations prevent them from admitting that it is their own policies that may be causing the slowdown. Their statements focus largely on external factors, such as rising oil prices or the slowdown in China’s economy.

Inasmuch as the G8 nations are unlikely to adopt the right kinds of policies as long as their leaders are attributing recessions (or the risk thereof) to overseas factors, I think Western economies could well enter a slowdown before China. In any case, we need to closely monitor the possibility of an economic downturn in these nations.


When speaking about Japan and its 20-year low-growth path and all the people who got the higher-rates-bet on the wrong side he cites those were 'based solely on the size of the deficits involved'.

With Moody's putting the Japanese Government-Debt Ratings Under Review and Fitch also with Japaland on negative outlook how will the 'higher rates' trade play out?

I guess the missing point here is inflation. Yes, without inflation people will keep buying 10yr JGBs at 1.20%.
But how will inflation be generated in Japan? This would make savings go into another direction instead of JGB purchases.

Perhaps this is THE question to ask. How will inflation be generated in Japan?
And I have been thinking that there should be, perhaps, more deflation before inflation kicks in.

So it will be interesting to see whether this will happen.
In 2009 yields dropped to around 1.05%.
In 2010, even with the european sovereign issues, yields dropped to 0.90%.
Recently yields have peaked at around 1.40% and are now down to 1.20%.

In case there IS another leg down in economic growth and risky-assets where would the 10yr JPY Swap go to?
I'm not sure, but if it dips lower and lower I would be an eager buyer of more out-of-the-money JPY swaption payers.

Economic issues (unemployment) would cause a dip into savings and reduce demand for bonds. That would be one, but at the same time in conflict with demand, so inflation shouldn't be an issue.

But economic issues could bring a bout of federal fiscual stimulus: monetization, money printing, JPY devaluation (with a positive current account?! Not if there's another severe economic downturn), therefore inflation?

Considering this bet is against one of the largest economies in the world and that all the OTHER economies wouldn't like to see a collapse in Japan what are the odds of this happening? 1%, 2%, 5%, 10%

A 4% 3y10y JPY Swaption payer costs around 90-100bps (for 9.xx duration swap, so about 10bps against the swap strike). And the volatility is considerably lower than in OTM EUR or USD swaptions. For a 3 year play. Is the risk-reward worth it? If yields go to 2.50% volatility would sky rocket with a lot of volatility-sellers scrambling to cover.

Comparisons of fiscal deficits with personal financial assets are meaningless

Because Japan’s fiscal expenditures have been financed by corporate savings and not household savings, it is meaningless to argue over what percentage of household financial assets the national debt represents. As I have argued previously, we must persuade businesses to begin borrowing again if we want to reduce these fiscal deficits. If the government stops borrowing at a time when neither households nor businesses are taking out new loans, the Japanese economy may weaken once again, as noted above.

Fiscal deficits during a balance sheet recession caused by an emergence of unborrowed private savings are fundamentally different from those rooted in fiscal profligacy in that, in the former, there are more than sufficient domestic savings to finance the deficits. With no private-sector borrowers left, these savings have nowhere to go but the government, the last borrower standing.

That is why fiscal deficits during balance sheet recessions do not lead to high interest rates, and why the massive budget deficits seen in the US and the UK have not pushed government bond yields higher. This phenomenon of a private savings surplus at a time of zero interest rates is a salient feature of all balance sheet recessions. Yet people who do not understand this have been predicting a rise in interest rates for the last 20 years based solely on the size of the deficits involved.

JGB yields continued to fall in spite of a national debt of more than 200% of GDP because the surplus of private savings grew even faster than the national debt. This dramatic increase in the private savings surplus was observed again following the Lehman-induced financial crisis and—although the statistics are not yet available—most likely after the recent earthquake as well.

2011 05 31 - Nomura - Richard Koo - Fiscal Consolidation Not the Answer

*Disclaimer: charts and data are presented as I receive/see them. Sources are usually not checked for validation and my own calculations are of 'back of the envelope'-type. I am aware that some math that I do myself might be wrong and/or misleading to some extent. In financial markets the rate of change of economic data is often more important than the actual level and the perception of 'what is priced in' is more important than 'what is actually going to happen'. This is actually the way people pick entry and exit points. So... yes, sometimes you might say 'This guy is an idiot, this is way wrong!' with a high conviction, being right. Not to worry. Markets are made of expectations and the clash of conviction between its participants. Portfolio managers know that being an idiot is sometimes profitable and being smart is often a bad choice. It is all reality, sometimes good, sometimes bad. By the way: corrections to my analysis and intelligent debate is welcome. theintriguedtrader AT gmail do com

Chicago PMI and its leading indicator

So if you get a lot of orders for new products you are likely to buy inputs, hire people and produce.
If you have a lot of inventory it is likely you don't need to produce as much. You just need to deliver.

What happens if the level in orders reduce while your level of inventory increases?
It doesn't bode well for the future, right?

So here are two charts.
The first is the Chicago PMI, which is back to 4Q09 levels.
And below is the (New Orders - Inventories) index which some fellas say works as a leading indicator.

That one is back to 4Q08 levels, right when Dick Fuld stopped dancing.


*Disclaimer: charts and data are presented as I receive/see them. Sources are usually not checked for validation and my own calculations are of 'back of the envelope'-type. I am aware that some math that I do myself might be wrong and/or misleading to some extent. In financial markets the rate of change of economic data is often more important than the actual level and the perception of 'what is priced in' is more important than 'what is actually going to happen'. This is actually the way people pick entry and exit points. So... yes, sometimes you might say 'This guy is an idiot, this is way wrong!' with a high conviction, being right. Not to worry. Markets are made of expectations and the clash of conviction between its participants. Portfolio managers know that being an idiot is sometimes profitable and being smart is often a bad choice. It is all reality, sometimes good, sometimes bad. By the way: corrections to my analysis and intelligent debate is welcome. theintriguedtrader AT gmail do com

Some updates on Japanese Economic Data

Some time ago I presented my bearish case on the Japanese economy

Yes, the earthquake + tsunami + ongoing nuclear issue have made things worse short term, but some people believe that in economic terms the future now looks brighter because the necessary reconstruction efforts will help the japanese.

I strongly disagree.

Some economic indicators haven't really recovered from pre-crisis levels and now, with this new hit, it will be even harder.

So a few updates of high-frequency data below...


*Disclaimer: charts and data are presented as I receive/see them. Sources are usually not checked for validation and my own calculations are of 'back of the envelope'-type. I am aware that some math that I do myself might be wrong and/or misleading to some extent. In financial markets the rate of change of economic data is often more important than the actual level and the perception of 'what is priced in' is more important than 'what is actually going to happen'. This is actually the way people pick entry and exit points. So... yes, sometimes you might say 'This guy is an idiot, this is way wrong!' with a high conviction, being right. Not to worry. Markets are made of expectations and the clash of conviction between its participants. Portfolio managers know that being an idiot is sometimes profitable and being smart is often a bad choice. It is all reality, sometimes good, sometimes bad. By the way: corrections to my analysis and intelligent debate is welcome. theintriguedtrader AT gmail do com

Monday, May 30, 2011

Curious data from the Dept of Energy

The American DOE releases weekly information about crude oil and its products (inventories, production, consumption, imports, etc).

Below is a chart of the total Oil Products supplied (DOEDTPRD Index on BBG) (12-week rolling average), YoY change and absolute levels. This number is a representation of demand from refineries.

So you can see that compared to last year we are now seeing a reduction in demand and from the chart below that consumption levels is only higher than 2009 and 1998~ levels....

Further down... 2 more charts, same thing for Crude imports, excluding those for the Strategic Reserves: YoY reduction in imports and levels very low historically speaking.

Basically the same thing with a more noticeable downward trend as crude prices picked up starting in early 2000. Import levels have been trending higher at the moment, but there's a high upward trend in seasonality right now.. check YoY levels.

Is the US changing its energy source? From Crude Oil (and its products) to Nat Gas, Coal or anything else?
Or has demand really been lower? Or a combination of both?


*Disclaimer: charts and data are presented as I receive/see them. Sources are usually not checked for validation and my own calculations are of 'back of the envelope'-type. I am aware that some math that I do myself might be wrong and/or misleading to some extent. In financial markets the rate of change of economic data is often more important than the actual level and the perception of 'what is priced in' is more important than 'what is actually going to happen'. This is actually the way people pick entry and exit points. So... yes, sometimes you might say 'This guy is an idiot, this is way wrong!' with a high conviction, being right. Not to worry. Markets are made of expectations and the clash of conviction between its participants. Portfolio managers know that being an idiot is sometimes profitable and being smart is often a bad choice. It is all reality, sometimes good, sometimes bad. By the way: corrections to my analysis and intelligent debate is welcome. theintriguedtrader AT gmail do com

About those Initial Jobless Claims

It might not be anything, but I'll write about this anyway. It makes some sense in my head.

A lot of PhD Economists have these models to capture seasonality in data, etc, but, considering that a lot of these models will get fundamental moves incorporated to their models as seasonality, I like to look at raw data, non-seasonally-adjusted, and compare it YoY or to the trend change compared to the year before (ie: how are we in Jan-May x 2010), etc.

Find below 3 charts of Initial Jobless Claims...

First 2 = 4wk average of IJC NSA, 52-week change (YoY). One of them since 1980, the other one since 1995.
In recessions the YoY change (52x52 period change in weekly data) increases and when the recovery sets in the chart goes down (reduction in claims x year ago).

The pattern was the same after the 82 recession (Volcker kicking some ass), 94s Tequila Crisis, 97s brief Asian Crisis, Dot-com bust 2000-2001, 2003s tiny double-dip and 2007-2009 Great Recession.
Deterioration has peaked from the dramatic mid-2009 levels, but now the YoY change seems to be close to positive levels again, meaning that there's higher risk that we will see deterioration in unemployment claims.

If you check out the 3rd chart you will notice that we're still with more claims than ALL years since 1998 with exception of 2009-2010 when the recovery was picking up.
Now also notice that the distance between 2011s path in 4wk-avg claims and 2010 has decreased from the bottom of the chart. As the YoY charts indicate, it means the recovery in jobs is actually slowing instead of accelerating as lots of people say.

Some might say that the deceleration is natural as the neutral level is somewhere around where we are, so changes in jobless claims will be less volatile to both sides... Some might say this is temporary, that it was weather impacting or that the japanese supply-chain reverbations are also temporary...

But I will step into the path of humbleness to say that I have no confidence that we are really going to see a pick up in growth, especially considering all the fiscal and monetary stimulus in place that should, as time goes by, have smaller impact on the economy.

The american economic backdrop (deleveraging) is certainly not supportive of such view if you consider the wearing-off stimulus.


*Disclaimer: charts and data are presented as I receive/see them. Sources are usually not checked for validation and my own calculations are of 'back of the envelope'-type. I am aware that some math that I do myself might be wrong and/or misleading to some extent. In financial markets the rate of change of economic data is often more important than the actual level and the perception of 'what is priced in' is more important than 'what is actually going to happen'. This is actually the way people pick entry and exit points. So... yes, sometimes you might say 'This guy is an idiot, this is way wrong!' with a high conviction, being right. Not to worry. Markets are made of expectations and the clash of conviction between its participants. Portfolio managers know that being an idiot is sometimes profitable and being smart is often a bad choice. It is all reality, sometimes good, sometimes bad. By the way: corrections to my analysis and intelligent debate is welcome. theintriguedtrader AT gmail do com

Friday, May 27, 2011

Weekly Recap

So we ended our week and what were the news?
Some more worse-than-expected news:
United States
 
All Housing numbers were very bad. The one better than expected (New Home Sales) is in catastrophe-2009-like levels still.
Real Spending and Income sort of flat for the year.
Durable goods revised+new data, added together, better than expected, but in a negative trend. Very volatile, though.
Initial Jobless claims again above 400k... @ 424. The 4wk-ma around 440k for the 4th week in a row. Next week the great +478k number disappears and if a new 420k comes this 4wk average will be @ 420k, still not enough to reduce the unemployment rate from what most economists say out there. THIS IS BAD in my opinion. To be looked at.
Japan
 
Trade Balance posting very bad results... exports plunged and the 12m rolling numbers also.
National CPI numbers, core, were positive 0.60% YoY
And the outlook on Japan was downgraded by Fitch.
Large Retailer numbers down YoY. Again.

What else?
The Greek drama not doing well with the IMF now likely to step out of the funding program since Greece didn't meet its austerity charges (greatly due to sky-rocketing interest costs!).

Anyway...

Fears of inflation in the US have disappeared and the short-end of the USD-rates curve pluged making new lows for the year. Rate hikes for 2011... nah.

Let's see how next weeks numbers play out.

My reading of the market moves haven't changed (here) and that means the slow down continues to play out. Social-security tax stimulus from early 1Q dissipates, consumed by higher gas prices and the Japanese-quake after-effects.

Economic numbers coming in worse than expected mean momentum is lost, job growth will falter and more easing will be priced in: risky assets get a new go, bonds rise, volatility is reduced again.

Until....

People realize liquidity won't be enough to support corporate earnings because those are generated by human beings consuming things. Not eating bond coupons or pieces of copper futures. Then risky-markets lose momentum and take a beating.
And more monetary and fiscal easing comes to the rescue.

Two charts.
Citi Economic Surprise Index on Bloomberg:
G10 Countries @ worst level since early 2009.
And still commodities are healthy, equity markets are healthy, cyclical currencies are doing remarkably well still.


US: Compared to last year's low when the Ben Bernanke was hinting about QE2 and 10yr USTs were around 2.50%, before making a low of 2.37% 6 weeks later.


Some other indicators that people don't really care about:

US For-Hire Truck Tonnage
Electricity Output
Railway Carloads
ECRI Leading Indicator


*Disclaimer: charts and data are presented as I receive/see them. Sources are usually not checked for validation and my own calculations are of 'back of the envelope'-type. I am aware that some math that I do myself might be wrong and/or misleading to some extent. In financial markets the rate of change of economic data is often more important than the actual level and the perception of 'what is priced in' is more important than 'what is actually going to happen'. This is actually the way people pick entry and exit points. So... yes, sometimes you might say 'This guy is an idiot, this is way wrong!' with a high conviction, being right. Not to worry. Markets are made of expectations and the clash of conviction between its participants. Portfolio managers know that being an idiot is sometimes profitable and being smart is often a bad choice. It is all reality, sometimes good, sometimes bad. By the way: corrections to my analysis and intelligent debate is welcome. theintriguedtrader AT gmail do com

Howard Marks: How Quickly They Forget

I strongly suggest you read this piece. 
Today I bring the wisdom of Howard Marks. Another of those guys that you don't need to make introductions because readers SHOULD know who he is. Not for who he is, but for the wisdom he has accumulated over the years. And for he spreads this wisdom in elegant ways.

Again he touches a VERY SIMPLE and one of THE MOST IMPORTANT aspects of investing: caution.

Risk aversion is, for sure, one of the most important qualities of any portfolio manager. Yes, it is a quality. Portfolio managers are not in the market to prove the world they're macho. PMs are around to make money. But to make money without the risk of losing a lot of it on the way or outright losing a lot of it and getting fired. But usually managers think "well, it is my client's money, not mine, that I am losing". A lot of people think like that. And these are the people you shouldn't hire to manage your money. They like the asymmetry of making big bucks in a good year and losing nothing on a bad year. That brings in wreckless risk-taking.

In Brazil we have a saying that translated outright into english would mean: "He who has an ass fears". I wonder if some do not fear or do not care about their asses.
People who do not fear must be very talented in order to succeed through many years in the markets. They are usually not cautious enough about risk-adjusted returns. They're usually not cautious enough about how to execute a trade idea:

They like what everyone likes when everyone likes it. That usually means it is expensive.
They hate what everyone hates when everyone hates it. That usually means it is cheap.
And some choose blindly the way to get into their trades. They sell cheap options or they make huge positions to gain a few basis points on them. That leaves the door open for big unexpected losses.

Risk-averse managers do not leave this door open. Because they believe these losses are not unexpected.

Mr. Marks goes on to say:
In January 2004 I received a letter from Warren Buffett (how’s that for name dropping?) in which he wrote, “I’ve commented about junk bonds that last year’s weeds have become this year’s flowers. I liked them better when they were weeds.”

Warren’s phrasings are always the clearest, catchiest and most on-target, and I thought this Buffettism captured the thought particularly well. Thus for Oaktree’s 2004 investor conference we used the phrase “Yesterday’s Weeds . . . Today’s Flowers” as the title of a slide depicting the snapback of high yield bonds. It showed the 45% average yield at which a sample of ten bonds could have been bought during the Enron-plus-telecom meltdown of 2002 and the 6% average yield at which they could have been sold in 2003; on average, the yields had fallen by 87% in just thirteen months. The idea went full-circle in 2005, when Warren used our slide at the Berkshire Hathaway annual meeting to illustrate how rapidly things can change in the world of investing.

And that’s the point of this memo. Asset prices fluctuate much more than fundamentals. This happens because, rather than applying moderation and balancing greed against fear, euphoria against depression, and risk tolerance against risk aversion, investors tend to oscillate wildly between the extremes. They apply optimism when things are going well in the world (elevating prices beyond reason) and pessimism when things are going poorly (depressing prices unreasonably). Shortness of memory plays a major part in abetting these swings. If investors remembered past bubbles and busts and their causes, and learned from them, the swings would moderate. But, in short, they don’t. And they may be forgetting again.

High yield bonds and many other investment media have once again gone from being weeds to flowers – from pariahs to market darlings – and it happened in a startlingly short period of time. As is so often the case, things that investors wouldn’t touch in the depths of the crisis in late 2008 now strike them as good buys at twice the price. The swing of this pendulum recurs regularly and creates some of the greatest opportunities to lose or gain. Thus we must always be mindful.

Since I am rather young I loved to read this part:
First, there’s investor demographics. When the stock market declined for three straight years in 2000-02, for example, it had been almost seventy years since that had last happened in the Great Depression. Clearly, very few investors who were old enough to experience the first such episode were around for the second.
For another example, I believe a prime contributor to the powerful equity bull market of the 1990s and its culmination in the tech bubble of 1999 was the fact that in the quarter century from 1975 through 1999, the S&P 500 saw only three minor annual declines: 6.4% in 1977, 4.2% in 1981, and 2.8% in 1990. In order to have experienced a bear market, an investor had to have been in the industry by 1974, when the index lost 24.3%, but the vast majority of 1999’s investment professionals doubtless had less than the requisite 26 years of experience and thus had never seen stocks suffer a decline of real consequence.
This is just brilliant. And this is, for sure, one of the reasons to why I give so much importance to reading about many of the famous investors of the world and history. These guys will tell you what it was like 'back then'. They will tell you 'how I got screwed back then'. And also 'what I learned back then'. The single most commented aspect of investing that I found through the tens of books I read was: risk-aversion is a quality.

And the final touch:
So if you could ask just one question regarding an individual security, asset class or market, it should be “is it cheap?” Oaktree’s investment professionals try to ask it, in different ways, every day
No further questions, your honor.
It is very important to keep in mind these basic aspects: risk-aversion + buying what is cheap.

Again, I strongly suggest you read this piece.
Oaktree Capital Management - 2011 05 25 - Howard Marks - How Quickly They Forget

*Disclaimer: charts and data are presented as I receive/see them. Sources are usually not checked for validation and my own calculations are of 'back of the envelope'-type. I am aware that some math that I do myself might be wrong and/or misleading to some extent. In financial markets the rate of change of economic data is often more important than the actual level and the perception of 'what is priced in' is more important than 'what is actually going to happen'. This is actually the way people pick entry and exit points. So... yes, sometimes you might say 'This guy is an idiot, this is way wrong!' with a high conviction, being right. Not to worry. Markets are made of expectations and the clash of conviction between its participants. Portfolio managers know that being an idiot is sometimes profitable and being smart is often a bad choice. It is all reality, sometimes good, sometimes bad. By the way: corrections to my analysis and intelligent debate is welcome. theintriguedtrader AT gmail do com

Krugman: Inflation Notes

Earlier this year I shared the view with Hugh Hendry that the UK was (is) going through a soft-patch and that, the headline and core inflation numbers are somewhat distorted and would likely come down as some time passed, with austerity kicking in, global deceleration in growth and the base effect of tax hikes and energy price shock.
All in all, the UK is still on the asset purchase strings and the last 2 quarters brought 0% growth in total.

Krugman brings a short piece by Adam Posen of the BoE:
The UK’s economic performance over the past year is no surprise. When you tighten fiscal policy significantly after a major financial crisis, both history and mainstream economics would tell you to expect what we have now : no growth in broad money or credit, persistently high interest spreads for small businesses and households, flat or contracting private consumption and retail sales, a dearth of construction and declining real wages – all only partially offset by some expansion in exports. In such a situation, you should expect little domestically generated inflation, and that is also just what the UK has.
The recent consumer price inflation rates above 4 per cent result from this year’s value added tax increase and the recent energy price shock. Removing those factors, UK inflation has averaged 1.5 per cent over the past year – including any remaining effects of sterling’s past decline. Of course, higher taxes and energy prices shrink British real incomes, but the monetary policy committee was right not to respond to them, and should not do so now.
 
The trade I had in mind at the time was receiving a 3m18m flattener through Short Sterling futures-spread, the L-M1L-Z2 @ 1.54% on March 2nd. (On the same day a Euribor flattener receiver, @ 1.16% (ERM1ERZ2)).
It seems likely there isn't a lot of juice left in them with the front-futures expiring in 3-4 weeks.

I'm waiting for Eclectica's April letter to see Hendry's comments on Japan and this Short Sterling receiver. It should be very interesting


*Disclaimer: charts and data are presented as I receive/see them. Sources are usually not checked for validation and my own calculations are of 'back of the envelope'-type. I am aware that some math that I do myself might be wrong and/or misleading to some extent. In financial markets the rate of change of economic data is often more important than the actual level and the perception of 'what is priced in' is more important than 'what is actually going to happen'. This is actually the way people pick entry and exit points. So... yes, sometimes you might say 'This guy is an idiot, this is way wrong!' with a high conviction, being right. Not to worry. Markets are made of expectations and the clash of conviction between its participants. Portfolio managers know that being an idiot is sometimes profitable and being smart is often a bad choice. It is all reality, sometimes good, sometimes bad. By the way: corrections to my analysis and intelligent debate is welcome. theintriguedtrader AT gmail do com

Thursday, May 26, 2011

Stephen Jen believes markets have topped.

Stephen Jen has left BlueGold Capital to open his own shop with another former BG quantitative research guy and is hiring! If you guys are interested... get in touch with him. It is a London-based HF.

Today he issued a nice and interesting commentary which I wish I would have written, but I guess his years of studying and experience are way ahead.


Very interesting insights which I agree with.

Bottom line: Had it not been for the news about DSK, the financial markets would have been so very boring in the past two weeks. The current risk-off phase makes sense to me.  In fact, I think risks are biased to the downside in the weeks ahead, as the second derivatives of global growth turn more negative, even if the first derivatives remain positive.  Furthermore, the nature of how QEII has helped buoyed risk assets since last September is likely to be fleeting - and certainly untrustworthy, in my own view.  As the Fed approaches the end of QEII, there will likely be an increase in the volatility of asset prices.  (1) The Okun’s Law not having worked (GDP growth without job growth) for much of the recovery in the past eight quarters has been used by the Fed as a key justification for QEII.  But as the labour market improves, despite the deceleration in headline GDP growth, QEIII would be a bit tricky to justify, even for the proactive Fed.  (2) It is my opinion that a meaningful portion of the rally in risk assets since Q4 2010 was liquidity-fuelled.  The Fed explicitly announced last fall that it would use QEII to ignite risk asset prices.  On this narrow measure, they have ‘succeeded.’  But as they complete this operation in the coming weeks, risk assets will likely remain very volatile.  (3) The European Debt Crisis is ‘cancer’ for Europe.  The idea of a currency union in Europe is not economically sensible, even if it is still politically attractive.  I continue to believe that there will not only be defaults by the insolvent member countries such as Greece and Portugal, the EMU itself is unlikely to survive in its current form over the medium term.  (4) I continue to suspect that, unless there is QEIII, it is likely that risk asset prices will peak in Q2; in fact, they may already have peaked.  A more stagflationary accent to the global economy will not be constructive for risk assets.    

Speaking about the European Debt Issue... to fuel some thoughts on my long German 5y CDS call this week Jen writes:
Why Europe’s policy choices are so difficult.  The situation in Europe is not good, and will get more complicated.  (1) The globalised economy is hyper-competitive; even once mighty nations like the US are struggling to keep up with Asia.  Portugal and Greece are not only uncompetitive within Europe, they do not have the institutional set-up, the necessary mind-set among the people, or the multinational companies to keep up with the rest of the world.  The indicator that best summarises the legacy debt and the inability to compete is (r-g), i.e., the interest rate to the GDP growth rate gap.  The weighted average cost of borrowing for the GIPS countries is more than three times higher than the expected economic growth rate for the next five years.  This gap will likely expand further, as economic growth is de-rated and interest rates rise further.


SLJ Macro Partners - 2011 05 26 - Stephen Jen - My Thoughts on Currencies


*Disclaimer: charts and data are presented as I receive/see them. Sources are usually not checked for validation and my own calculations are of 'back of the envelope'-type. I am aware that some math that I do myself might be wrong and/or misleading to some extent. In financial markets the rate of change of economic data is often more important than the actual level and the perception of 'what is priced in' is more important than 'what is actually going to happen'. This is actually the way people pick entry and exit points. So... yes, sometimes you might say 'This guy is an idiot, this is way wrong!' with a high conviction, being right. Not to worry. Markets are made of expectations and the clash of conviction between its participants. Portfolio managers know that being an idiot is sometimes profitable and being smart is often a bad choice. It is all reality, sometimes good, sometimes bad. By the way: corrections to my analysis and intelligent debate is welcome. theintriguedtrader AT gmail do com

Barton Biggs: HANG IN THERE

Mr. Biggs comes out again with about the same thoughts of last time, not too long ago.

The most interesting he mentions is, of course, the improvement in credit, according to SLO Survey:

I don’t believe the prolonged soft patch story. I think this is a temporary hiatus and that the U.S. is still in a self-sustaining, albeit moderate, economic expansion. All the production negatives cited above are dissipating, and the employment picture is slowly but steadily improving. Corporate profits and balance sheets are very strong, and capital spending is rebounding. The latest senior loan officers’ survey indicates a recovering propensity to borrow. With the fed funds rate virtually at zero, bankers are regaining their commercial instincts. Fed policy is extremely stimulative with an expanded balance sheet.
What I find interesting in this case is that across some of the tables we see a lot of easing in credit standards. Good for the banks?
Yes if the increase in risk isn't proportional. That I doubt.
Demand is the important part, not credit standards. There's certainly not an issue anymore with SUPPLY of credit.
There's an issue with SUPPLY of good Creditors. Balance sheets have been repaired? Not that much. A lot of consumer deleveraging was actually defaulting, not paying down debt.

Who is demanding credit and why. Are these clients good enough?

If the people that say that 44m americans are living with food stamps and that only a small portion of the jobs recovered since 2007 were high-income / full-time are true and correct I don't think that this issued credit will represent a good risk for the economy even though it will provide the US with more growth and jobs.

And we're way into this cycle, into this sailing-along recovery. Confidence still protracted, the housing double-dip that Biggs also mentions, is out there. Foreclosures are in pause, when they come in full throttle (banks do not want that as they push prices lower, economy down, etc) more people who are now living rent-free (in their foreclosing-houses) will need to pay for housing.

Well, followers of the blog know that I am on the US-will-suffer-after-QE2-ends wagon.
Its economy, in my humble opinion, will experience another slow down and, if markets come down and the Fed doesn't react.. double-dip.

Biggs mentioned:
Senior Loan Officers' Survey (full report)
Senior Loan Officers' Survey (interesting tables)
Senior Loan Officers' Surveys (summary)

2011 05 10 - Itaú Global Connections #43 - Barton Biggs, Traxis Partners


*Disclaimer: charts and data are presented as I receive/see them. Sources are usually not checked for validation and my own calculations are of 'back of the envelope'-type. I am aware that some math that I do myself might be wrong and/or misleading to some extent. In financial markets the rate of change of economic data is often more important than the actual level and the perception of 'what is priced in' is more important than 'what is actually going to happen'. This is actually the way people pick entry and exit points. So... yes, sometimes you might say 'This guy is an idiot, this is way wrong!' with a high conviction, being right. Not to worry. Markets are made of expectations and the clash of conviction between its participants. Portfolio managers know that being an idiot is sometimes profitable and being smart is often a bad choice. It is all reality, sometimes good, sometimes bad. By the way: corrections to my analysis and intelligent debate is welcome. theintriguedtrader AT gmail do com

SocGen Albert Edwards - S&P @ 400 sub-2% US bond yields?

Albert Edwards talks about his expectations of massive private debt being transferred to governments' balance sheets to cause another deflationary period. I agree with him. The just out US 1Q11 GDP numbers were pretty bad. And that is on the back of never-seen-before fiscal and monetary stimulus GLOBALLY.

So back to Edwards, a realist in my opinion.

Deleveraging will take place and ultimately risky-asset prices will come down causing another recession, deflation and then rising bonds prices.

He disagrees with Russell Napier, CLSA, that argued weeks ago that the market would collapse with rising bonds yields. That rising yields would be the cause of the collapse. Back then I mentioned that I didn't understand his point, therefore disagreeing.

I am on Edwards's camp.

Edwards believes bond yields will only rise AFTER the bust, when governments are forced to print massively to save the world.

Despite fully acknowledging the ruination of the government balance sheets as years of excess private sector debt are transferred to the public sector, we still expect to suffer another deflationary bust that will take government bond yields to new lows BEFORE government profligacy and the Fed's printing presses take us back to both double-digitinflation and bond yields. For now, we remain heavily overweight government bonds.


SocGen Alternative View - 2011 05 25 - Albert Edwards - Let Me Re-emphasize Our 400 S&P Forecast With S...

*Disclaimer: charts and data are presented as I receive/see them. Sources are usually not checked for validation and my own calculations are of 'back of the envelope'-type. I am aware that some math that I do myself might be wrong and/or misleading to some extent. In financial markets the rate of change of economic data is often more important than the actual level and the perception of 'what is priced in' is more important than 'what is actually going to happen'. This is actually the way people pick entry and exit points. So... yes, sometimes you might say 'This guy is an idiot, this is way wrong!' with a high conviction, being right. Not to worry. Markets are made of expectations and the clash of conviction between its participants. Portfolio managers know that being an idiot is sometimes profitable and being smart is often a bad choice. It is all reality, sometimes good, sometimes bad. By the way: corrections to my analysis and intelligent debate is welcome. theintriguedtrader AT gmail do com

Wednesday, May 25, 2011

MacroAdvisors out with 2Q GDP growth @ 2.8%

Krugman and Brad DeLong tell the world what Macro Advisors just downgraded their estimate of 2Q GDP down from 3.2% to 2.8%.

Brad says:
Time to push the panic button.
Macroeconomic Advisers is revising their tracking forecast of real GDP growth in the second quarter. It now looks as though, come July 1, that there will have been no gap-closing in the six quarters since the start of 2010.
That means that it is:
  • Time for Quantitative Easing III...
  • Time for pulling more spending from the future forward into the present, and pushing more taxes from the present back into the future...
  • Time to use Fannie and Freddie to (temporarily) nationalize mortgage finance and fix the ongoing foreclosure crisis...
  • Time for a weaker dollar...


*Disclaimer: charts and data are presented as I receive/see them. Sources are usually not checked for validation and my own calculations are of 'back of the envelope'-type. I am aware that some math that I do myself might be wrong and/or misleading to some extent. In financial markets the rate of change of economic data is often more important than the actual level and the perception of 'what is priced in' is more important than 'what is actually going to happen'. This is actually the way people pick entry and exit points. So... yes, sometimes you might say 'This guy is an idiot, this is way wrong!' with a high conviction, being right. Not to worry. Markets are made of expectations and the clash of conviction between its participants. Portfolio managers know that being an idiot is sometimes profitable and being smart is often a bad choice. It is all reality, sometimes good, sometimes bad. By the way: corrections to my analysis and intelligent debate is welcome. theintriguedtrader AT gmail do com

Jim Chanos on China (interview): "We're not bearish enough"

Fast-forward it to 6min20 if you only want to check his view on Chinese real-estate developers.

Chanos doesn't need introductions so I will go straight to the point:

"The bubble is really on the other side of the world. What my team found, they actually came back saying we're not bearish enough. The signs of overcapacity were even much greater than their last visit, which was late last year, and increasingly the executives that they met with were sounding a little bit more uncomfortable about the current situation."
"If you look at the balance sheets of the developers, you'd be hard-pressed to see how healthy they are because they're all loaded up with land just as our developers were at the top of our market," he said. "We've maintained our pretty much dramatic overweight in our Chinese shorts."

When asked about Bloomberg's Adam Johnson who was in China doing research and interviewed a developer who mentioned there's no problem with building since the government pays them ahead:

"You can't pre-sell and use the proceeds for the next development. That's changed."

*Disclaimer: charts and data are presented as I receive/see them. Sources are usually not checked for validation and my own calculations are of 'back of the envelope'-type. I am aware that some math that I do myself might be wrong and/or misleading to some extent. In financial markets the rate of change of economic data is often more important than the actual level and the perception of 'what is priced in' is more important than 'what is actually going to happen'. This is actually the way people pick entry and exit points. So... yes, sometimes you might say 'This guy is an idiot, this is way wrong!' with a high conviction, being right. Not to worry. Markets are made of expectations and the clash of conviction between its participants. Portfolio managers know that being an idiot is sometimes profitable and being smart is often a bad choice. It is all reality, sometimes good, sometimes bad. By the way: corrections to my analysis and intelligent debate is welcome. theintriguedtrader AT gmail do com

Tuesday, May 24, 2011

Hate Spain? Why buying 5y Germany CDS makes sense

Why going long Germany 5y CDS @ 40bps makes sense:

Considering that the markets aren't as naive as in 2008 (Germany CDS below 10bps) and the recent lows were around 20bps and there are possible catalysts in the upcoming months it seems like a good risk-reward bet. Worst case/stop-loss: 5x20bps = -100bps ([20out-40in] * 5y duration) in a sweet spot scenario.

Now consider that the recent highs, where stress and volatility we in vogue, were around 60bps.. that's a 1:1 bet.
But the convexity is on your side on this trade. If things turn out to be worse than expected. If there is a restructuring. If global economic activity slows down. Etc. Out of question, but odds are higher than what the market is pricing.

Why this bet?
Spain.

These guys aren't doing so well. They sure look like they're improving, but we cannot forget that their growth isn't sufficient to bring Debt/GDP down.

Current yields on short-term debt (easier to find buyers), close to near-term highs.
3m Bill @ 1.43%
1y Bill @ 1.95%
1.5y Bill @ 2.25%
2y Bill @ 3.69%

Unemployment rate above 20%, still not quite declining, but stabilizing at an elevated level.
Industrial production still close to the lows.
Retail Sales making new lows.
The Housing industry is still very, very bad and it was a great source of revenue for the local governments.Now a big source of mortgage problems.
Trade Balance is still looking pretty bad.
Current Account, you all know the story.

I am really not sure what will be able to pull Spain out of its current orbit.
Without a sovereign currency to devalue... The current pile of debt, even though relative-to-GDP small compared to Greece, Ireland, Italy, Japan, will not go down any time soon. That is my belief.

Fiscal deficits + higher yields on debt than the country's growth rate + negative current account and trade balance + high structural unemployment + can't devalue its way out.

The bet doesn't seem too bad for a horizon of 3-6m. If nothing happens that's 10-20bps in costs (90/360 * 40bp to 180/360*40bp). 
Cheaper than a 10% OTM S&P Index Put for the same time horizon (3.8months, ESU1P 1200 @ 20pts = 1.5%, 8x more costly).

The debt load on Spain is huge and it is piled onto balance sheets all over Europe.
What if the guys who won elections this Sunday find those talked-about local hidden bills and make it public?
A. Lost confidence will spook investors.
B. The aggregate debt to GDP number will look even worse.
C. Trichet could (I don't think he will) hike rates by more than 25bps in 2011, making things even worse for liquidity and opportunity cost "Why buy Spain 3m bill @ 1.43% if Germany is @ 0.89%"?
D. Housing still deteriorating will put more pressure on balance sheets: household and corporate/financials.
E. Activity will stall.

Yes... perhaps european banks, the DAX, the IBEX or the EUR will suffer much more, much faster and the volatility on the puts would explode, but I still like the trade due to its lower volatility in carry and much longer time horizon to get things right.


*Disclaimer: charts and data are presented as I receive/see them. Sources are usually not checked for validation and my own calculations are of 'back of the envelope'-type. I am aware that some math that I do myself might be wrong and/or misleading to some extent. In financial markets the rate of change of economic data is often more important than the actual level and the perception of 'what is priced in' is more important than 'what is actually going to happen'. This is actually the way people pick entry and exit points. So... yes, sometimes you might say 'This guy is an idiot, this is way wrong!' with a high conviction, being right. Not to worry. Markets are made of expectations and the clash of conviction between its participants. Portfolio managers know that being an idiot is sometimes profitable and being smart is often a bad choice. It is all reality, sometimes good, sometimes bad. By the way: corrections to my analysis and intelligent debate is welcome. theintriguedtrader AT gmail do com