The almighty Non-Farm Payrolls were released today, survey for the April 12th week.
And the Household survey was also out.
NFP numbers were great: +244k gain
Household survey: -190k jobs.
David Rosembearish was on Bloomberg TV saying that Household survey is a better turning-point indicator. I'm not sure, but I like the guy, you know?
So the strong NFP didn't diverged from the huge increase in Initial Jobless Claims. When the NFP was surveyed IJC 4wk moving average was at 396k. Yesterday this metric was @ 431k. A sizable increase.
The markets reacted positively to the NFP news until rumors of Alpha-Beta-Gamma Debt-Mogul Greece leaving the Eurozone hit the market.
EURUSD crashed.
Deutsche Bank stocks got nailed... down 3.5%.. Puts volumes were 11-12x the regular volume or something like that.
E-Minis were around 1350.. then closed negative @ 1334ish.
The Commodities slump continued and the rally in bonds also (up to 10yr US Treasury).
Rogers Commodity Index: -1%
GSCI: -1.44%
WTI -2.6%
Even our friend Bill Gross came out of the woods to defend his 'I hate US Treasuries' call! I guess Jeff Gundlach from Double Line is going to have a great weekend! To wit, Jeff said Billy was wrong. He expected the US economy to slow down, therefore bringing with it these juicy UST yields. Spot. On.
BUT... a bit of that kind of data no ones talks about. Perhaps because it has no predictive power.
Association of American Railroads released the weekly Freight Carloads.
The 4-week moving average data SEAG looks as below. I am no expert at all, but I like to look at some different data... I'm not a big fan of boring sell-side reports and their opinions.

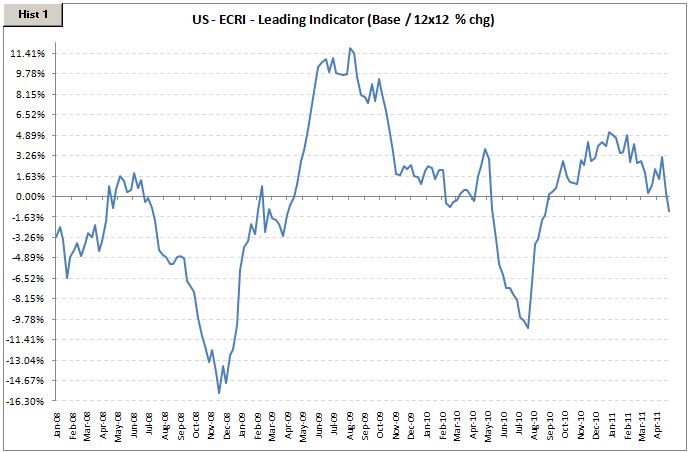
ECRI Leading Indicator, YoY:
ECRI Leading Indicator, 3m x 3m:
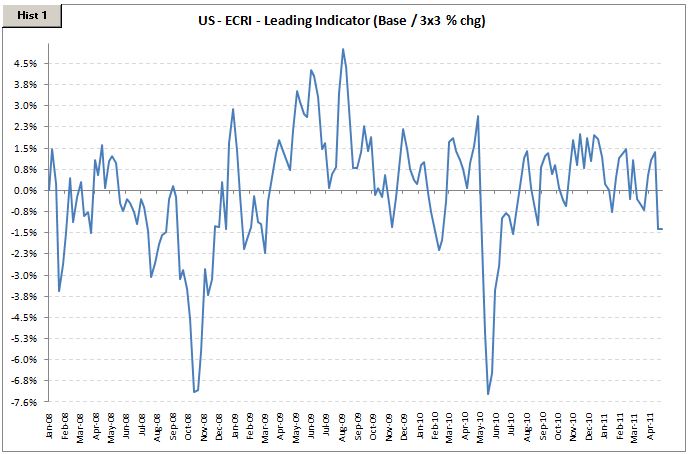
So... QE2 is ending and I believe the U.S. Activity will slow down considerably and the risk-markets will suffer... a lot.
From JP Morgan:
April saw growth of the global economy ease sharply for the second successive month to its weakest pace since the recovery began in August 2009. The weaker rate of expansion mainly reflected a significant cooling of business activity growth in the US non-manufacturing sector and further steep contractions in output at both Japanese manufacturers and service providers.
The JPMorgan Global All-Industry Output Index plunged to 51.8, well below February's near five-year peak of 59.1. Growth eased in both the global manufacturing and service sectors. The extent of the slowdown in services was especially marked, with the rate of expansion the lowest during the current 21-month period
of increase. Growth of manufacturing output fared better, but still slipped to its weakest pace since last September.
All-industry output in the US rose at the slowest rate in seven months. Growth eased in China, the UK and Brazil, but picked up slightly in the Eurozone and India. The rate of contraction in Japan was the sharpest since March 2009.
2011 05 06 JPMorgan - Global Growth Slow Down
No comments:
Post a Comment